


(↰) Sub Topics
|
|
|
|
Operational Capacity Overview
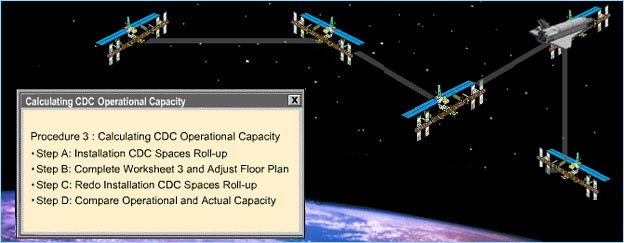
Procedure 3: Calculating CDC Operational Capacity
Definitions for Space Census terms are provided below:
| Census-ese | ||||||||||||||||||||||||||||||
|
Meeting to Determine Operational Capacity
“I’ll need to meet with other members of the Child Development Services family to complete this procedure.”
The numbers and ages of children and the programs offered in your CDC are partially dependent upon the numbers and ages of children and programs offered by other CDC and FCC programs. Calculating Operational Capacity occurs as a joint effort led by the CYS Coordinator and attended by installation CDC Directors and other staff.
Select each link for a list of the personnel and materials needed at the Operational Capacity meeting.
| Personnel |
|
| Materials and Forms |
|
Calculating Operational Capacity
Before the Operational Capacity meeting, all the Directors send the Coordinator the data they have already collected through Procedures 1 (Calculating Actual Capacity of Entire CDC) and 2 (Calculating CDC Adjusted Design Capacity). The Coordinator rolls this data up to be reviewed during the meeting.
There are four key steps to follow as a group to determine your CDC Operational Capacity:
- Step A: Review and discuss the Installation CDC Spaces Roll-up.
- Step B: Complete Worksheet 3 and adjust the floor plan.
- Step C: Redo the Installation CDC Spaces Roll-up.
- Step D: Compare Operational Capacity with Actual Capacity.
|
|
|
|
Combined actual capacity in all installation CDC programs
| CDC: | INFANT SPACES | PRE-TODDLER SPACES | TODDLER SPACES | FD Preschool SPACES | PD PS SPACES* | K’GARTEN SPACES | SCHOOL-AGE SPACES | HOURLY | TOTAL | ||
|---|---|---|---|---|---|---|---|---|---|---|---|
| CDC 1 | 8 | 25 | 28 | 40 | AM | 40 | AM | 40 | 15 | 20 | 216 |
| PM | 40 | PM | 40 | ||||||||
| Satellite | 0 | 0 | 0 | 0 | AM | 40 | AM | 0 | 0 | 0 | 40 |
| PM | 0 | PM | 40 | ||||||||
| CDC 2 | 32 | 40 | 28 | 80 | AM | 20 | AM | 20 | 0 | 0 | 220 |
| PM | 20 | PM | 20 | ||||||||
| TOTAL | 40 | 65 | 56 | 120 | 80 | 80 | 15 | 20 | 476 | ||
| Percentage of spaces, by age, your CDC provides | ||||||||||||||||||||||||||||||||||||
|
| Percentage of spaces for infants and toddlers compared to Army metrics | |||||||||||||||||
|
| Percentage of spaces for full-day, part-day, and hourly modules compared to Army metrics | ||||||||||||
NOTE: Full Day Kindergarten counts as PD, AM or PM Kindergarten counts as Full-Day |
Let’s Apply the Numbers!
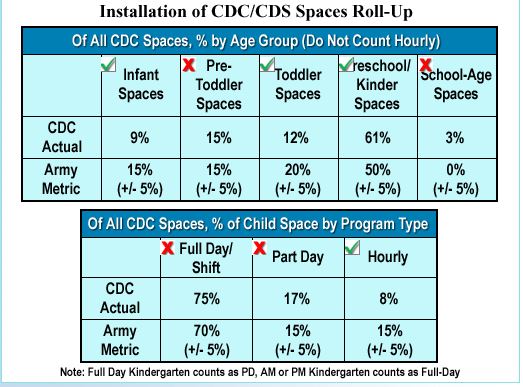
Take a closer look at the roll-up numbers on the charts shown. Notice that the bottom row of both charts lists the Army metric for each age group and type of care.
Let’s see if you can determine where Fort Wonderful is falling short of the Army metric. Click on the charts to reveal areas where there’s a discrepancy of more than +/- 5%.
Spaces Roll-Up
|
|
|
|
Determining Strengths and Potential Problems
Once you’ve looked at the numbers, you should determine strengths, potential problems, and solutions for your CDC.
- Refer to the Installation Roll-up data and analyze where the Installation CDS Program’s strengths and potential problems lie. If, for instance, yours is the only CDC on the installation and you have converted your hourly-care room to a toddler room due to demand, you will need to re-configure because the Army metric calls for at least 15% hourly-care spaces.
- Next, turn your focus to your CDC. List the potential problems and determine what changes could be made to make best use of your facility.
Here’s what Pamela determined with her team during the meeting:
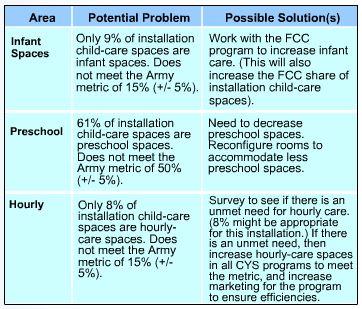
Strengths & Potential Problems
Step B: Complete Worksheet 3 and Adjust the Floor Plan
“My team and I are back on track. We put together a comprehensive list of strengths, potential problems, and solutions, and we’re ready to move on to the next step.”
Step B has two parts — completing Worksheet 3 and adjusting your CDC’s floor plan.
Click here to view a demonstration of how to complete Worksheet 3.
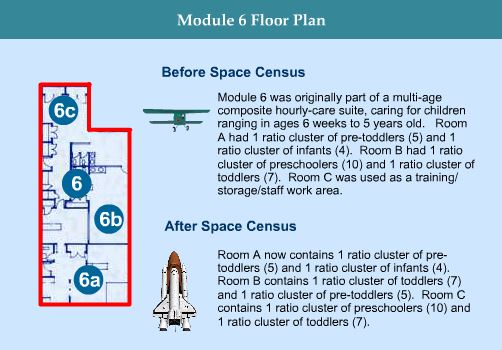
Adjust the Floor Plan
Now that you have described how you would do things differently, how would these changes look on a floor plan?
You made a tentative floor plan when you determined your Adjusted Design Capacity. You may need to make adjustments based on the Installation CDC Spaces Roll-up and Operational Capacity. If so, you should use a blank copy of the floor plan diagram and develop a new floor plan for each module.
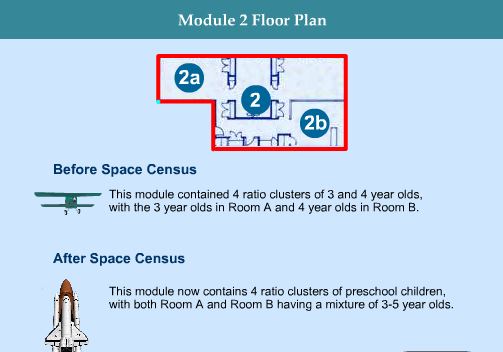
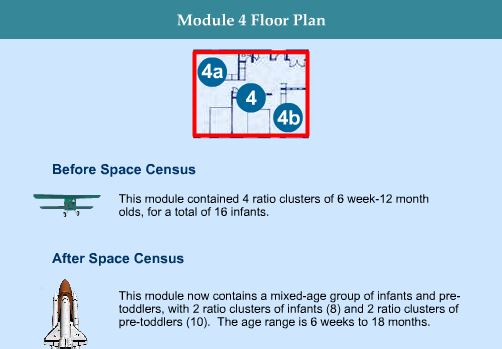
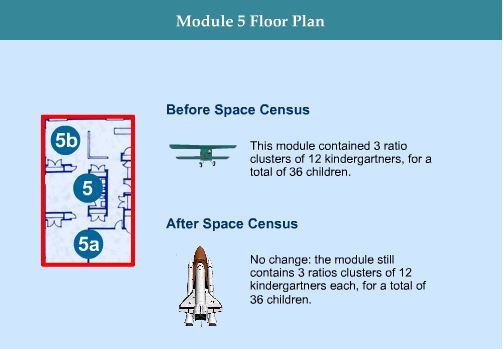
Adjusted Floor Plan
The images below show how changes have been made to this floor plan.
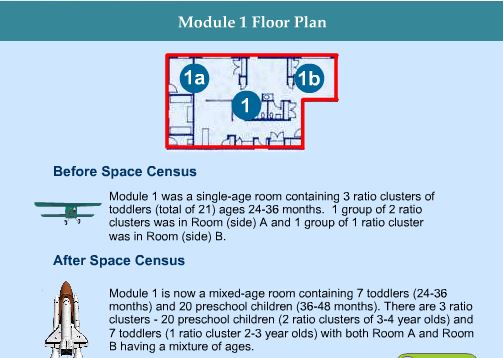
Adjusted Floor Plan

Step C: Redo the Installation CDC Spaces Roll-up
“Calculating Operational Capacity is proving to be incredibly valuable for us. At first, I thought it was going to be difficult to do, but once we did it, our plan of action was much clearer.”
In Step C, you will redo the Installation CDC Spaces Roll-up based on what you learned about your CDC in Step B.
- As a team, recalculate the Installation CDC Spaces Roll-up Sheet. (Your Coordinator has this sheet and will guide you through the process.)
- If your installation numbers now meet the Army metrics, continue on to Step D.
- If not, you and the CYS Space Census team will identify the problem(s) and try the process again, either until the numbers are within acceptable ranges or you have an agreement with your Region to allow the variance based on unique circumstances.
Spaces Roll-Up Process Chart
Step D: Compare Operational Capacity with Actual Capacity
Finally, in Step D, you compare Operational Capacity with Actual Capacity.
- Gather Worksheet 1-A and Worksheet 3.
- Compare your Actual Capacity (along with your paid enrollments) with your Operational Capacity. Note: The target for your CDC is Operational Capacity. However, you are funded based on your Actual Capacity.
- If your Actual Capacity is less than your Operational Capacity, you are losing funding and are not maximizing the capability of the CDC. Determine what needs to be adjusted, set a new target, and create a plan for meeting it.
- Include your plan for meeting your new target in your ICOP.
